Debugging anRTC could be a nightmare if you do not know the right tools. In this article, we discuss some of the readily available tools that can be used to debug WebRTC applications.
Debugging WebRTC Applications on Desktop Chrome
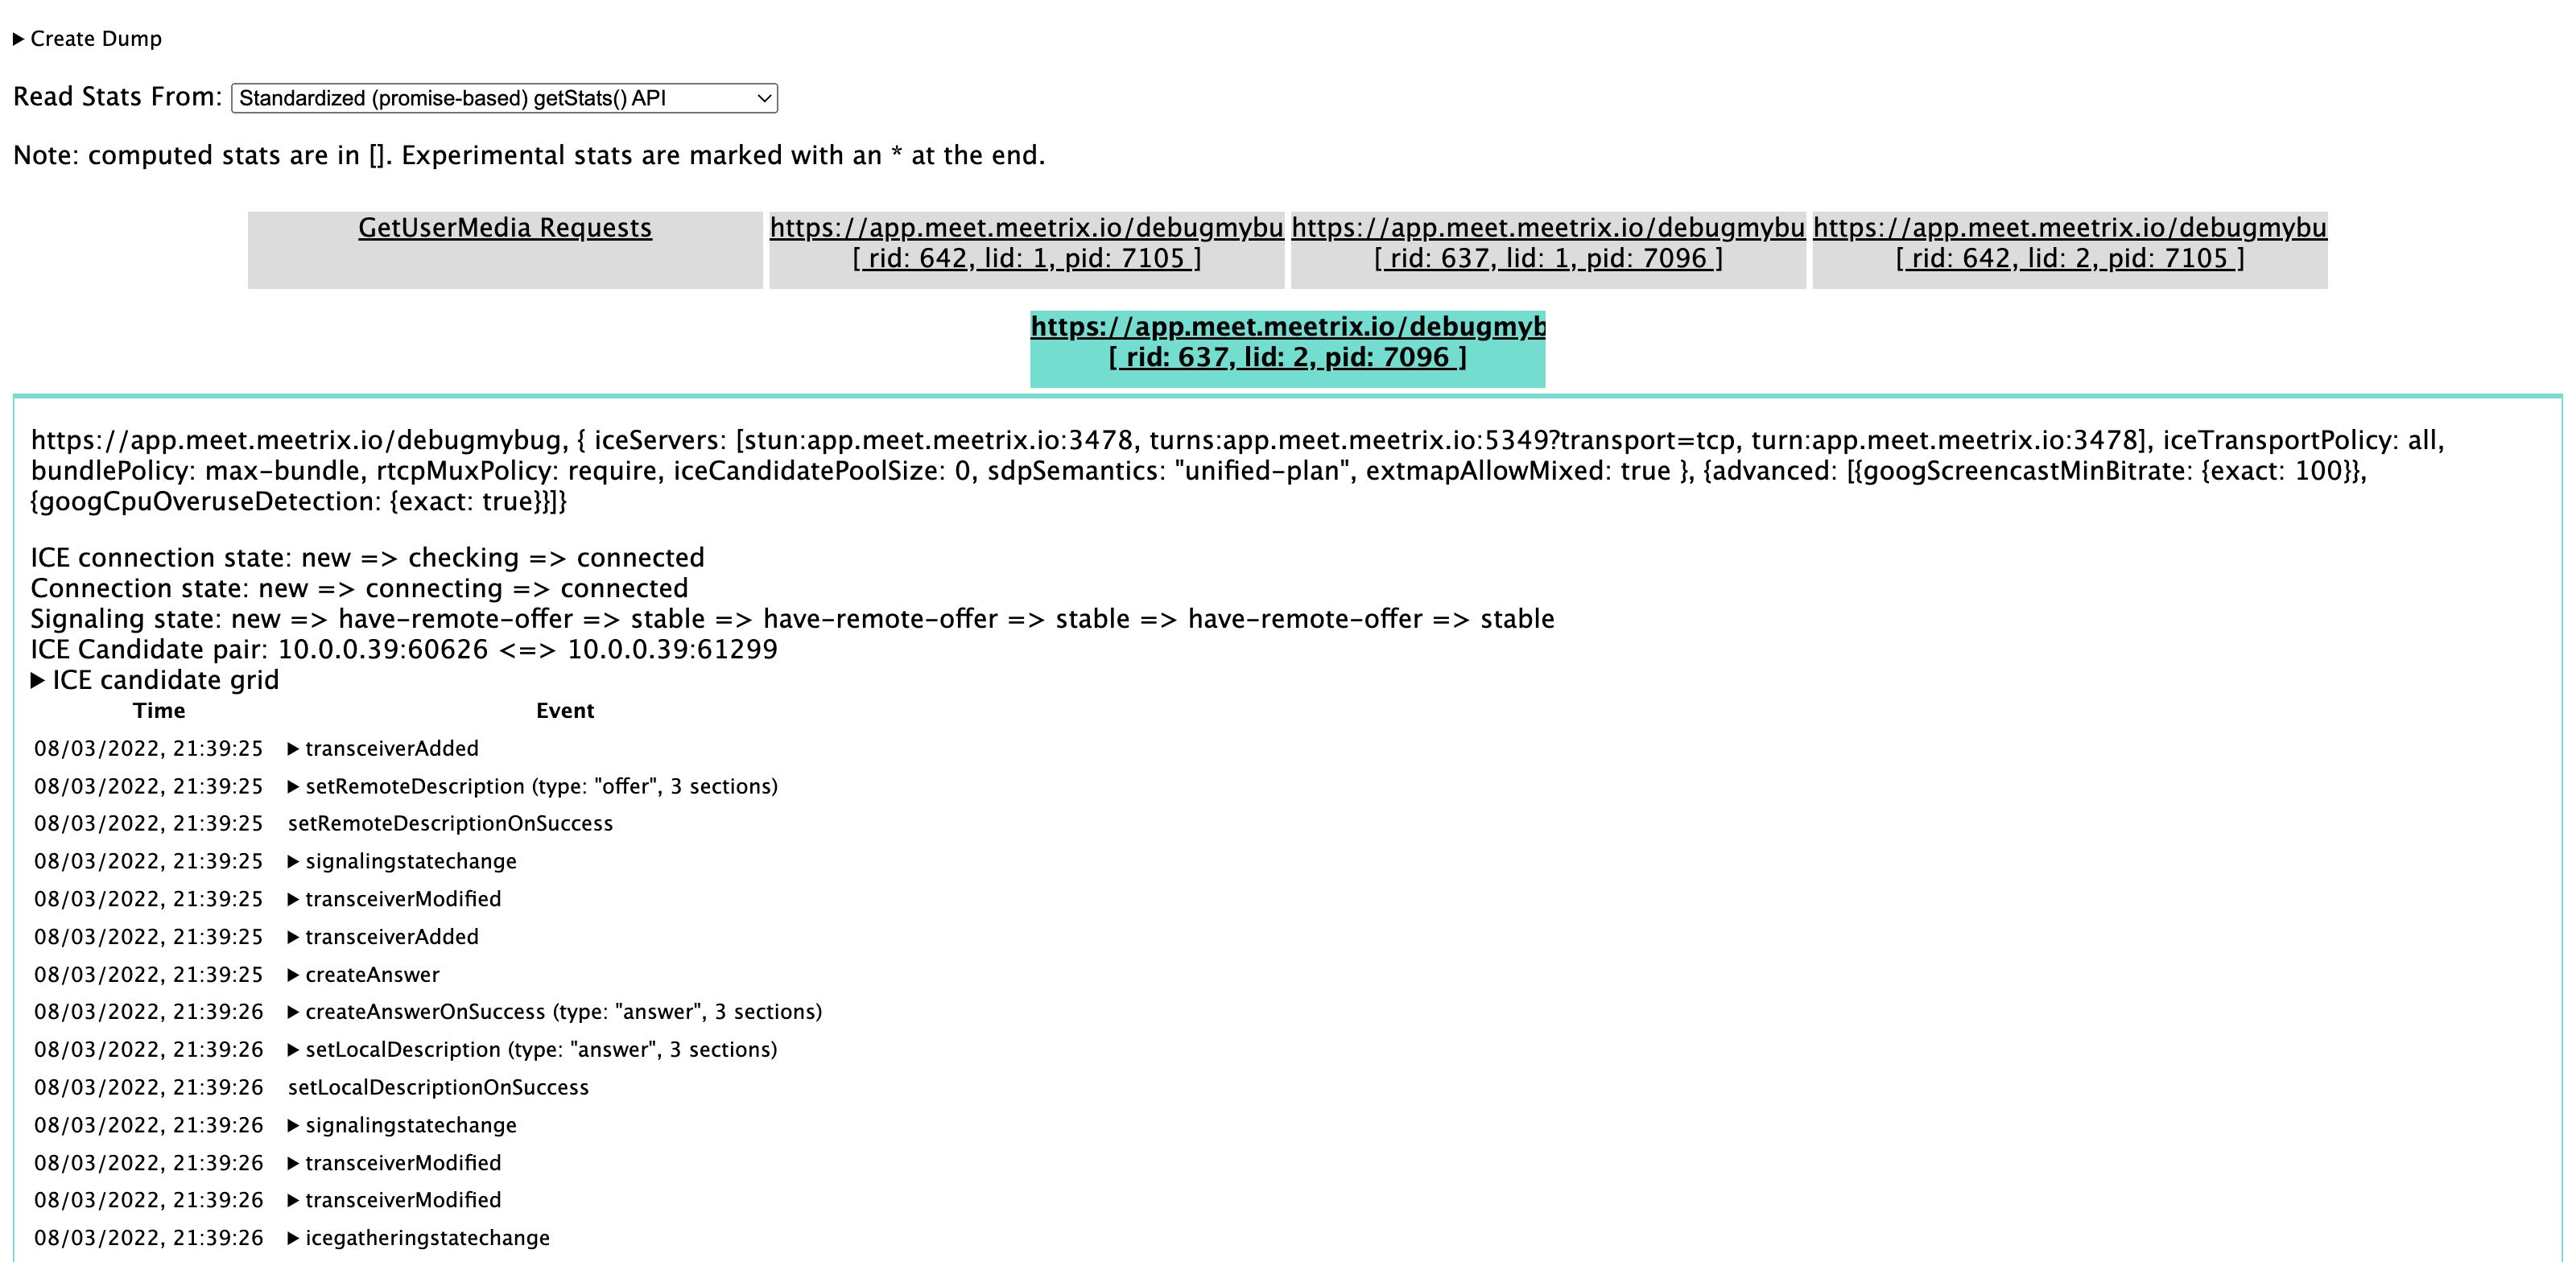
[chrome://webrtc-internals] is probably the most popular debugging tool among developers. This is super helpful when it comes to identify common WebRTC issues that can be reproduced on Mac, Windows and Linux desktop environments. Using [chrome://webrtc-internals] you can see all the information related to iceServers, iceCandidates, SDPs, Signaling Status, Network, Track Health and Media capabilities. You can also create a dump and save it for further analysis.
[chrome://media-internals/] is another tool that can be used to debug issues with media capture and playback.
Debugging WebRTC Applications on iPhone and iPad Safari

To debug WebRTC issues on iPhone Safari, you have to connect your iPhone to your Mac and enable developer options first. Then,
- Open your application on iPhone
- Open Safari on your Mac and select `Develop ->
-> - On the debug window, click on the cogwheel and set
WebRTC LoggingtoVerbose - Click on console. Now you should be able to see WebRTC events and you should be able to inspect them.
Leave a Comment